Water Flow Monitoring
About Radwell Flow Gauge
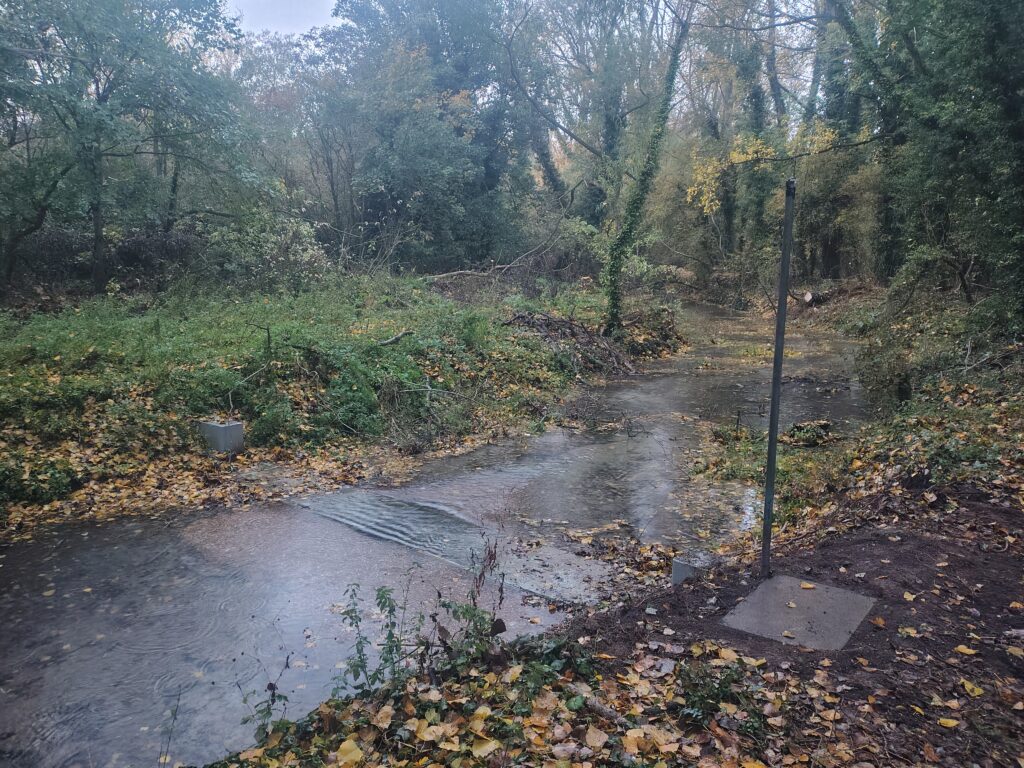
In September 2025, and with permission of the The Upper Ouse Water Management Board, revIvel built a flow monitoring station in the river Ivel just below Radwell Mill. The idea was not to install a weir or some other structure which would hinder movement of fish or other aquatic life in the river, but to create a precisely known profile across the bottom and sides of the river which could be used to accurately measure, or 'gauge' river flow. Originally we were going to install a 'doppler depth and velocity' sensor which is a device attached to the bottom of the gauge capable of accurately measuring water velocity and depth as it crosses the gauge, but once the gauge was in place there was some doubt this rather expensive device would work in the shallow water of the unnaturally low flows we have been experiencing in the late summer of recent years.
Instead, in November 2026 we installed a radar device which accurately measures water level (known as 'stage' by Hydrologists) inside a stilling well which is a chamber connected to the river by a pipe in which the water is at exactly the same 'stage' as it is at the gauge, but not disturbed by ripples, debris or anything else.
The device sends a stage measurement several times every hour to an online database via a LoRa wireless connection.
With these measurements and the precisely known dimensions of the gauge, it is possible to calculate flow (known as 'discharge' by Hydrologists) across the gauge using Manning's Equation. The stage measurements are averaged over the sample period and calculated into discharge in that period.
In the graph above, time is always in GMT and river discharge is shown in units of Megalitres per day - Ml/d - 1 million litres per day, which is the unit most commonly used when measuring and comparing river discharges. To be clear, a discharge of 2 Ml/d does not mean that 2 million litres has passed by in that period, it means that if the discharge stayed the same for 24 house as when it was observed at 2 Ml/d, then 2 million litres will have passed over the gauge. Another way of looking at it is if the period is 1 hour then 2 million litres divided by 24 = 83,333 litres passed over the gauge in that hour.
Rainfall
The rainfall plot uses Environment Agency rainfall data from their real-time data API (Beta) specifically from their gauge at Letchworth Sewage Treatment Works (STW) which is about 2.5 km from this flow gauge. Their data is collected into our database at very regular intervals and is summed into the sample periods on display.
Calibration
For all sorts of reasons there could still be differences between the calculated discharge and the true discharge at different stages.
The standard scientific method for measuring discharge in small rivers is the Velocity-Area method. This technique, described in ISO 748/2021, divides the river cross-section into multiple vertical subsections, measuring the width, depth, and water velocity in each using a current meter, then summing them to find total discharge.
We will be regularly doing this using the exact same method and calculation as Affinity Water have been doing in the same location since 2015. As time goes by, this procedure will be repeated throughout the discharge range allowing rating equations for our gauge to be developed which facilitate the conversion of stage into calibrated river discharge.
Because the stage measurements we collect are immutable, all our discharge figures should become progressively more accurate as we collect more calibration data. This could take several years.
The Environmental flow indicator
An Environmental Flow Indicator (EFI) is a scientific standard used by the Environment Agency (EA) to define the allowable deviation from natural flow regimes caused by human interventions such as abstraction that is required to protect river ecology, support sustainable water use, and achieve Good Ecological Status (GES).
revIvel's 2022 Lawson Report, using EA's own data, shows discharge to achieve GES at Radwell should be at least 6.6 Ml/d for at least 95% of the time (Q95). As a comparison, the report also shows that if there was no abstraction affecting the river at all (a 'natural' flow) then the discharge at Radwell would never be less than 10 Ml/d and usually a lot more. This compares favourably with the historical minimum 14 Ml/d required to drive the ancient mills at Radwell and Stotfold for 8 hours a day.
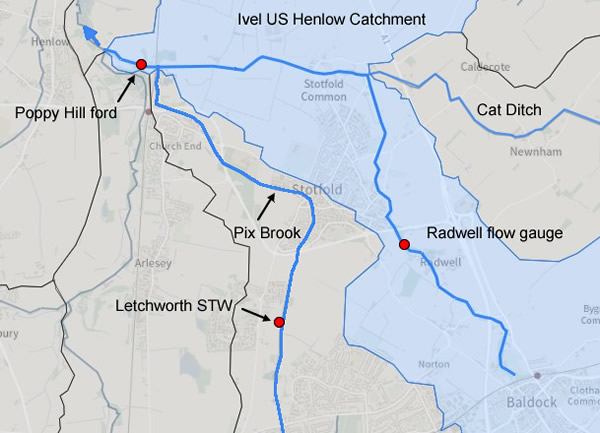
It is easy to see from the graph that discharge today at Radwell is nowhere near being above its EFI for 95% of the time but astonishingly, the Environment Agency map shows the Upper Ivel as having a Good Ecological Status anyway. This is because they choose to measure discharge from the catchment at Poppy Hill ford which includes discharge from Letchworth Sewage Treatment Works (STW) carried there via Pix Brook. This trick of adding in discharge from another catchment which also happens to have a STW discharging a minimum of 10 Ml/d every day allows them to claim compliance for the whole catchment even when most of it is actually bone dry.
It's important because the law requires EA to find ways to return all water courses to a GES by the end of 2027. When revIvel challenged them about this fakery in 2024 EA conceded there was some sort of 'methodology anomaly', but despite regular reminders from revIvel, have so far have done nothing to correct it, possibly because a downgrade to the correct state would show up badly in their performance statistics. This means there remains very little formal incentive for any water company or government agency to do anything which might begin to edge the Upper Ivel towards a genuinely Good Ecological Status.